
Quick read
- Palo Alto's July 2026 single-family median sale price was $4,280,000 with homes averaging 17 days on market and selling at 108% of list (SCCAOR/MLSListings).
- At that median, with 20% down and a 7% illustrative mortgage rate, qualifying household income lands near $900,000 a year under a 36% DTI ratio.
- Effective property tax in Palo Alto runs roughly 1.15% to 1.25% of purchase price annually under Proposition 13, which adds about $3,900 a month on a $4M home.
- Most jumbo lenders count RSUs as a two-year average plus a forward look at vesting, not as the trailing pay stub number.
- Qualifying income and comfortable income are different. Buyers who treat them as the same usually regret it within two years.
This page is for the buyer who already knows Palo Alto is expensive and wants the actual numbers. The math is grounded in current Palo Alto sales data, standard jumbo underwriting ratios, and the property tax reality California buyers often underestimate. Lisa M. Lum is a Realtor with Coldwell Banker Realty on the Peninsula; what follows is the same income walkthrough she runs with new buyers.
The two questions hiding inside "how much do you need to earn"
When buyers ask how much household income they need to afford to buy in Palo Alto, they are usually asking two different questions at once. The first is the underwriting question: what household income will a lender require to approve the loan. Lenders use debt-to-income ratios, and the classic 28/36 rule is shorthand for "housing should not exceed 28% of gross income, total debt service no more than 36%." Jumbo lenders in this price band often stretch to 40% to 43% DTI for strong borrowers with reserves, but 36% is the conservative anchor used throughout the tables below.
The second is the lifestyle question: what household income makes the payment livable once you layer in property tax, insurance, maintenance, child care or private school tuition, and retirement saving. This number is almost always higher than the qualifying number. The honest answer to "how much salary to buy in Palo Alto" usually sits 20% to 40% above the qualifying minimum, and the tables below give you both lenses.
The assumptions: what these income numbers are built on
Every income figure on this page is built from the same conservative, transparent inputs:
- Mortgage rate. The main income table below is computed at a 7.5% 30-year fixed rate; some scenarios on this page use a 7% rate for comparison. Both are illustrative. Actual rates change weekly and jumbo rates often run a quarter point above or below the Freddie Mac headline. Verify with your lender.
- Property tax. 1.20% of purchase price annually. Prop 13 caps the base levy at 1% of assessed value (which resets to your purchase price), and Palo Alto's parcel taxes and bonds bring the effective rate to 1.15% to 1.25%.
- Homeowners insurance. $400 a month. Older or larger Palo Alto homes can run materially higher.
- Debt-to-income ratio. 36% DTI, assuming housing is the only material debt. Student loans, car payments, or HELOCs raise the income required.
- No HOA. SFR figures assume no HOA. Townhomes and condos often carry $400 to $900 a month in dues that flow into DTI like a debt.
Illustrative assumptions, not a quote. Your lender's product, credit profile, reserves, and debt picture will shift the income required in either direction.
Income by price tier: how much household income you need at each level
The Palo Alto market does not behave as a single price point. The table below maps household income required against four common purchase price tiers, each at three down payment levels. Monthly figures are PITI (principal, interest, property tax, insurance) at a 7.5% illustrative rate. The qualifying income column uses a 36% DTI ratio and assumes no other material debt.
| Purchase price | Down payment | Loan amount | Monthly PITI | Qualifying income (36% DTI) |
|---|---|---|---|---|
| $2,500,000 condo or smaller SFR | 20% ($500,000) | $2,000,000 | $16,800 | $560,000 |
| 30% ($750,000) | $1,750,000 | $15,140 | $505,000 | |
| 40% ($1,000,000) | $1,500,000 | $13,475 | $449,000 | |
| $3,500,000 Midtown, Barron Park entry SFR | 20% ($700,000) | $2,800,000 | $23,440 | $781,000 |
| 30% ($1,050,000) | $2,450,000 | $21,115 | $704,000 | |
| 40% ($1,400,000) | $2,100,000 | $18,790 | $626,000 | |
| $5,000,000 upper Midtown, Crescent Park entry | 20% ($1,000,000) | $4,000,000 | $33,400 | $1,113,000 |
| 30% ($1,500,000) | $3,500,000 | $30,075 | $1,003,000 | |
| 40% ($2,000,000) | $3,000,000 | $26,750 | $892,000 | |
| $7,000,000 Old Palo Alto, estate-scale | 20% ($1,400,000) | $5,600,000 | $46,760 | $1,559,000 |
| 30% ($2,100,000) | $4,900,000 | $42,105 | $1,404,000 | |
| 40% ($2,800,000) | $4,200,000 | $37,450 | $1,249,000 |
Figures are rounded. PITI assumes 7.5% interest, 1.20% effective property tax, $400 a month insurance, and a 30-year amortization. Qualifying income assumes no other debts.
Down payment moves the bar as hard as price does.
Qualifying household income at 36% DTI, Palo Alto, by purchase price and down payment
At every tier the gap between 20% down and 40% down is worth roughly $110,000 to $310,000 of required income. Computed at 7.5% interest, 1.20% effective property tax, $400 a month insurance, 30-year amortization. Illustrative, not a quote.
At every tier, the spread between 20% and 40% down shifts qualifying income by roughly $110,000 to $310,000. Down payment, not just price, is what changes who can actually buy. The Palo Alto July 2026 median of $4,280,000 sits between the $3.5M and $5M rows: qualifying household income lands near $900,000 at 20% down, and roughly $800,000 at 30% down.
Property tax is the line item buyers underestimate
Out-of-state buyers tend to budget the mortgage and forget the tax bill. Proposition 13 resets your assessed value to your purchase price, then caps annual increases at 2% going forward. The locked-in protection is real, but the starting number is full price. Santa Clara County's combined effective rate, once parcel taxes and bond measures layer in, generally lands between 1.15% and 1.25% of purchase price annually.
| Purchase price | Annual property tax (1.20%) | Monthly tax |
|---|---|---|
| $2,500,000 | $30,000 | $2,500 |
| $3,500,000 | $42,000 | $3,500 |
| $4,280,000 (July 2026 SFR median) | $51,360 | $4,280 |
| $5,000,000 | $60,000 | $5,000 |
| $7,000,000 | $84,000 | $7,000 |
About a sixth of the payment is not the loan.
Monthly PITI at 20% down, Palo Alto, 7.5% illustrative rate
Principal and interest $13,900 · property tax $2,500 · insurance $400
Principal and interest $19,540 · property tax $3,500 · insurance $400
Principal and interest $28,000 · property tax $5,000 · insurance $400
Principal and interest $39,360 · property tax $7,000 · insurance $400
On a $7M purchase, property tax alone runs $7,000 a month. Split computed from the PITI figures in the table above at 1.20% effective property tax and $400 a month insurance.
For deeper detail on how new owners get billed in the first 12 months of ownership, including catch-up amounts when your assessment is reset above the seller's, see the supplemental property tax calculator for California. Many first-time Peninsula buyers are caught off guard by a supplemental bill that arrives months after close.
RSU and stock comp reality: how lenders count what tech buyers actually earn
Most Palo Alto buyers are not living on base salary alone. They are stacking base, bonus, and vested restricted stock units, and how a lender treats that mix changes the household income they will underwrite by hundreds of thousands of dollars a year. The rules of thumb Lisa sees most often on jumbo Palo Alto files:
- Two-year history. Most lenders require two full years of RSU vesting history, documented through pay stubs, W-2s, and a vesting schedule. A new hire with one year of RSU income often cannot count it yet.
- Forward vesting runway. Lenders look for two to three years of remaining scheduled vesting. If your refresh grants are heavily back-loaded, expect questions.
- Averaging method. The conservative approach is a 24-month trailing average of vested RSUs converted to a monthly figure. More aggressive lenders use a 12-month average if the trend is up. Both are common in this market.
- Sign-on bonuses and unvested equity. Generally not counted as qualifying income.
- Volatile stocks. A material drop in your employer's share price between application and funding can shrink your qualifying income within the same transaction.
Two buyers with identical W-2 totals can qualify for very different homes depending on how their lender stacks the components. Lining up the right jumbo lender early, especially one that understands tech compensation, is one of the highest-leverage decisions a Palo Alto buyer makes.
Qualifying income vs. comfortable income: how much you actually need to earn
The qualifying income table is the floor. The comfortable number is what makes the rest of your life work. On a $4M purchase, qualifying income at 36% DTI with 20% down lands near $865,000. That figure does not account for:
- Maintenance reserves on a 50- to 90-year-old home, where a single roof or foundation project can run $80,000 to $250,000.
- Private school or daycare on the Peninsula, often $35,000 to $65,000 per child per year.
- Retirement contributions sized to actually retire on, not the bare 401(k) match.
- California top-bracket income tax on the salary required to service the payment.
- Property tax escalation, capped at 2% annually under Prop 13 but compounding over time.
Most of Lisa's clients in the $4M to $5M Palo Alto band carry household incomes between $1.1M and $1.6M when you include all forms of comp. They are not stretching to the minimum. The jumbo loan calculator for Silicon Valley walks through the additional reserve and asset requirements lenders look for here; reserves of 6 to 12 months of PITI are common.
Down payment patterns: what most Palo Alto buyers actually put down
The qualifying income tables show why down payment is the lever. The most common patterns Lisa sees:
- 20% down jumbo buyers. Typically dual-income tech professionals stepping up from a smaller condo or a rental. Higher monthly carry, but they preserve liquid capital for renovations or reserves.
- 30% to 40% down buyers. The largest segment, often after a liquidity event, a prior home sale, or accumulated multi-year RSU vesting. The lower loan amount opens additional lender options and frequently produces a better rate.
- All-cash buyers. A meaningful share of Palo Alto transactions clear without a loan, especially at the upper end and among out-of-state relocations. Many later place a mortgage after close.
- Multi-generational support. A family contribution structured as a gift letter or family loan can move a buyer up an entire price tier. Lenders accept gifts when documented properly.
In a market where Palo Alto homes sold at 108% of list and averaged 17 days on market in July 2026 (SCCAOR/MLSListings), a clean 30% down offer with verified reserves often beats a stretched 20% offer at the same price.
Neighborhood reality: where the income math actually lands you
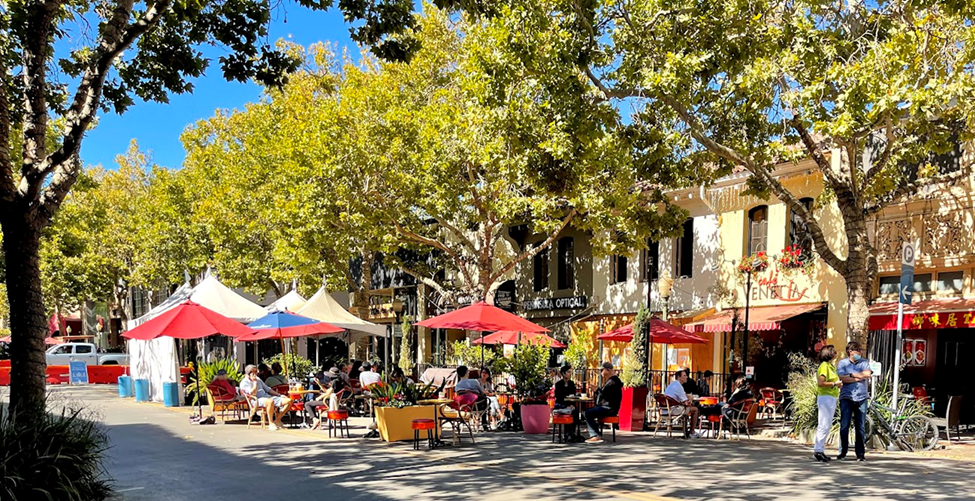
Palo Alto is not one neighborhood. The same household budget can place you comfortably in Midtown, marginally in Crescent Park, or not at all in Old Palo Alto.
- Midtown. 1950s and 1960s ranch and Eichler architecture on roughly 6,000 to 8,000 square foot lots. The most common entry point for PAUSD-bound buyers, clustering in the $3M to $4.5M range. Maps to the $3.5M tier above.
- Old Palo Alto. Grand 1920s estates and modern reconstructions on 7,500 to 15,000+ square foot lots. Commands the highest medians in the city. Maps to the $5M to $7M+ tiers, with many transactions well above.
- Crescent Park. Estate-scale lots, heritage trees, early-twentieth-century architecture. Sits in the $5M to $7M tier on full-size homes.
- Greenmeadow and Barron Park. South Palo Alto pockets with Eichler concentrations and slightly larger lots in Barron Park. Generally one tier below Old Palo Alto pricing for comparable square footage.
- Condos and townhomes citywide. July 2026 condo median sat at $1,437,500 (SCCAOR/MLSListings). For single-income buyers, materially more reachable than the SFR median.
The Palo Alto Homes & Real Estate Guide covers sub-neighborhood pricing and school-attendance boundaries in detail.
The bottom-line income table for Palo Alto buyers
For buyers who want one consolidated view of how much you need to earn for a home in Palo Alto, the table below summarizes qualifying household income at the most common price points and a 30% down payment, with a separate column showing a reasonable comfortable-life income target.
| Purchase price | 30% down loan | Monthly PITI | Qualifying income (36% DTI) | Comfortable income |
|---|---|---|---|---|
| $2,500,000 | $1,750,000 | $15,140 | $505,000 | $650,000 to $750,000 |
| $3,500,000 | $2,450,000 | $21,115 | $704,000 | $900,000 to $1,050,000 |
| $4,280,000 (July 2026 SFR median) | $2,996,000 | $24,600 | $820,000 | $1,000,000 to $1,200,000 |
| $5,000,000 | $3,500,000 | $30,075 | $1,003,000 | $1,300,000 to $1,500,000 |
| $7,000,000 | $4,900,000 | $42,105 | $1,404,000 | $1,800,000 to $2,200,000 |
The floor a lender approves is not the livable number.
Annual household income at 30% down, Palo Alto, by purchase price
Qualifies at $505K · comfortable at $650K to $750K
Qualifies at $704K · comfortable at $900K to $1.05M
Qualifies at $820K · comfortable at $1.0M to $1.2M
Qualifies at $1.00M · comfortable at $1.3M to $1.5M
Qualifies at $1.40M · comfortable at $1.8M to $2.2M
The distance between the dot and the bar is what maintenance reserves, tuition, retirement saving, and California top-bracket tax cost. Qualifying income computed at 36% DTI; the comfortable range is a planning estimate, not a rule. Median price: SAMCAR / SCCAOR · MLSListings, July 2026 single-family closings.
Comfortable income is a planning range, not a rule. It assumes maintenance reserves, retirement saving, two private school or daycare slots, and California top-bracket taxation on the income required.
For the broader Peninsula purchase context from search through close, the Silicon Valley Home Buyer's Guide covers offer strategy, contingency timelines, inspection sequencing, and closing costs.
What this means for you
Affording to buy in Palo Alto is less about a single salary number and more about the combination of household income, down payment, and how your lender treats the income you actually earn. The qualifying figure is the floor; the comfortable figure is what makes the home work.
If you want a personalized walk-through of the income math for your situation, including which jumbo lenders fit your compensation structure, Lisa is happy to help. Start the conversation at lisamlum.com/contact.
Frequently Asked Questions
Q: What household income do you need to buy a median-priced home in Palo Alto?
A: Based on Palo Alto's July 2026 single-family median sale price of $4,280,000 (SCCAOR/MLSListings), a buyer putting 20% down on a $3.4M jumbo loan at a 7% illustrative rate would carry roughly $27,000 a month in principal, interest, property tax, and insurance. That maps to a qualifying household income of about $900,000 a year at a 36% debt-to-income ratio. A 30% down payment lowers the bar to roughly $800,000.
Q: Is the salary to buy in Palo Alto the same as what a lender will approve?
A: No. The income required to qualify under a 28/36 ratio is rarely the income that makes the payment comfortable. Most Palo Alto buyers carry property tax, private school tuition, and lifestyle costs that compress what looks like an affordable mortgage on paper. The qualifying number and the comfortable number are usually 20% to 40% apart.
Q: How do lenders treat RSUs and stock comp when sizing a Palo Alto mortgage?
A: Most jumbo lenders take a two-year average of vested RSUs plus a forward look at upcoming vesting, often requiring a remaining vest runway of two to three years. Sign-on bonuses and unvested equity are generally not counted. The way a lender stacks your RSUs against base salary changes the income they will underwrite by hundreds of thousands a year.
Q: What is the property tax on a Palo Alto home?
A: Under California's Proposition 13, your assessed value resets to the purchase price. Effective property tax in Palo Alto runs roughly 1.15% to 1.25% of purchase price annually once parcel taxes and bond measures are added. A $4M home generates roughly $46,000 to $50,000 a year in property tax, or about $3,900 a month inside your PITI.
Q: How much do you need to earn for a $5M home in Palo Alto?
A: A $5M home with 30% down (a $3.5M loan) at a 7% illustrative rate carries roughly $32,000 a month in PITI. To qualify under a 36% DTI ratio, you would need household income near $1.07M. With 20% down and a $4M loan, the income bar rises to roughly $1.21M.
Q: Can a single tech salary afford a home in Palo Alto?
A: On a single $500,000 to $700,000 base salary alone, qualifying for a typical Palo Alto single-family home is difficult. Buyers in this band usually pair base salary with vested RSUs, partner income, or a larger down payment from prior equity events. Condo and townhome inventory, where July 2026 medians sat near $1,437,500, can be more reachable on a single income.
Q: What down payment is typical in Palo Alto?
A: Anecdotally, the most common down payment Lisa sees in Palo Alto is 30% to 40%, with a meaningful share of all-cash buyers. 20% down is the floor most jumbo lenders will accept on this price band, and going below requires specialty products with tighter underwriting.