Quick read
- San Mateo County's median rose to $2,200,000, matching May for the highest monthly median from March through October. Sellers averaged 108% of list, up from 106%.
- Santa Clara County's median rose 6.9% to $2,010,000, back above $2 million for the first time since May. Sellers averaged 104% of list.
- Homes sold faster: an average of 21 days in San Mateo County, from 28, and 23 days in Santa Clara County, from 27.
- Combined single-family closings eased to 1,009 from 1,045. Santa Clara County's new listings fell 14.8%, to 803.
- Atherton, Los Altos, Daly City, San Carlos, San Bruno and Belmont led on competitive pressure, each clearing 111% of list or better.
- Santa Clara County's condo and townhome median rose to $900,000 on 279 sales, with sellers at 100% of list for a third month.
What Happened to the Silicon Valley Housing Market in October 2026?
Prices climbed in both counties, and homes sold faster doing it. Fewer new listings came to market in Santa Clara County, and buyers paid more for the ones that did.
San Mateo County's median rose to $2,200,000 from $2,175,000, up 1.1%. That matches May's figure, the highest monthly median in the county reports from March through October.
Santa Clara County's median rose to $2,010,000 from $1,880,000, up 6.9%. It's the first reading above $2 million since May's $2,050,000.
Median price per square foot rose 2.5% in both counties, to $1,196 in San Mateo County and $1,122 in Santa Clara County. Part of a median move is always which homes closed, and the per-square-foot figure moved the same way this month.
Single-family closings eased to 1,009 from 1,045 across the two counties. San Mateo County rose to 340 from 319, while Santa Clara County fell to 669 from 726. Combined sale volume still edged up, to $2,686,157,333 from $2,655,248,771.
The pace quickened. Average days on market fell to 21 from 28 in San Mateo County and to 23 from 27 in Santa Clara County.
Sellers averaged 108% of list in San Mateo County, up from 106%, and 104% in Santa Clara County, up from 103%.
Supply went two ways. San Mateo County's new listings slipped to 409 from 420, but active inventory rose to 508 from 476, and months of supply ticked up to 1.5 from 1.4.
Santa Clara County's new listings fell to 803 from 943, down 14.8%, and active inventory held at 1,225 against 1,224.
| Measure | July | August | September | October |
|---|---|---|---|---|
| San Mateo median price | $2,123,000 | $2,075,000 | $2,175,000 | $2,200,000 |
| San Mateo homes sold | 366 | 321 | 319 | 340 |
| San Mateo avg. days on market | 25 | 25 | 28 | 21 |
| San Mateo % of list received | 106% | 107% | 106% | 108% |
| San Mateo months of supply | 1.0 | 1.1 | 1.4 | 1.5 |
| Santa Clara median price | $1,900,000 | $1,850,000 | $1,880,000 | $2,010,000 |
| Santa Clara homes sold | 711 | 624 | 726 | 669 |
| Santa Clara avg. days on market | 27 | 25 | 27 | 23 |
| Santa Clara % of list received | 102% | 103% | 103% | 104% |
Source: SAMCAR and SCCAOR, data collected and compiled by MLSListings, Inc. Santa Clara County does not publish months of supply.
What Did 7% Mortgage Rates Do to October's Bidding?
Freddie Mac's Primary Mortgage Market Survey logged the 30-year fixed at 6.95% on September 17, 7.03% on September 24, 7.28% on October 1, and 7.40% on October 8 and October 15.
The bidding held up through that stretch. Sellers averaged more of list price in both counties than they did in September, and average days on market fell.
The rate has eased since its peak: 7.32% on October 22, 7.24% on October 29, 7.18% on November 5, and 7.11% on November 12. It's still well above the 6.24% of a year earlier, recorded on November 13, 2025.
Where Did Buyers Compete Hardest in October 2026?
Percent of list price is the cleanest measure of competitive pressure. Save this list, it's the fastest way to see where an offer needed to be sharp this month.
- Atherton: 113% of list, up from 103%, an average of 8 days, 9 sales, an $8,100,000 median, 2.3 months of supply.
- Los Altos: 112% of list, up from 108%, an average of 16 days, 38 sales (September had 25), a $5,073,000 median, $2,075 per square foot.
- Daly City: 112% of list, an average of 15 days, 26 sales, a $1,305,000 median.
- San Carlos: 111% of list, up from 108%, an average of 12 days, 18 sales, a $2,500,000 median, 0.9 months of supply.
- San Bruno: 111% of list, up from 105%, an average of 13 days, 20 sales, a $1,670,000 median.
- Belmont: 111% of list, up from 105%, an average of 20 days, 19 sales, a $2,600,000 median, 0.8 months of supply.
- Sunnyvale: 110% of list, an average of 14 days, 41 sales, a $2,668,000 median.
- Millbrae: 110% of list, an average of 11 days, 11 sales, a $2,375,000 median.
- Burlingame: 109% of list, an average of 20 days, 23 sales, a $3,510,000 median, 0.7 months of supply, tied with Foster City for the tightest in San Mateo County.
- Redwood City: 109% of list, up from 104%, an average of 18 days, 41 sales, a $2,455,000 median.
- Palo Alto: 108% of list, an average of 13 days, 46 sales (September had 40), a $3,835,000 median, $2,180 per square foot.
- San Mateo: 108% of list, an average of 15 days, 42 sales, a $2,375,500 median, 1.2 months of supply.
- Menlo Park: 104% of list, an average of 23 days, 25 sales, a $3,250,000 median (September was $4,169,194), $1,633 per square foot, 30 new listings, 1.4 months of supply.
"October's buyers carried a 7% rate and still paid more of the asking price than September's did. The fall market came back sharper."
Hillsborough turned around. It averaged 108% of list across 10 sales and an average of 8 days, from 98% and 42 days in September, at a $6,075,000 median. Atherton's 9 sales are a thin read, so take its 113% with the count beside it.
| City | Median price | Sold | Avg. DOM | % of list |
|---|---|---|---|---|
| Atherton | $8,100,000 | 9 | 8 | 113% |
| Los Altos Hills | $7,100,000 | 13 | 28 | 102% |
| Hillsborough | $6,075,000 | 10 | 8 | 108% |
| Los Altos | $5,073,000 | 38 | 16 | 112% |
| Portola Valley | $4,550,000 | 7 | 38 | 105% |
| Saratoga | $4,240,000 | 17 | 22 | 104% |
| Palo Alto | $3,835,000 | 46 | 13 | 108% |
| Woodside | $3,750,000 | 5 | 91 | 98% |
| Burlingame | $3,510,000 | 23 | 20 | 109% |
| Menlo Park | $3,250,000 | 25 | 23 | 104% |
| Mountain View | $3,093,444 | 24 | 18 | 105% |
| Cupertino | $3,040,000 | 28 | 16 | 106% |
| Los Gatos | $2,800,000 | 27 | 38 | 100% |
| Sunnyvale | $2,668,000 | 41 | 14 | 110% |
| Belmont | $2,600,000 | 19 | 20 | 111% |
| San Carlos | $2,500,000 | 18 | 12 | 111% |
| Redwood City | $2,455,000 | 41 | 18 | 109% |
| San Mateo | $2,375,500 | 42 | 15 | 108% |
| Millbrae | $2,375,000 | 11 | 11 | 110% |
| Campbell | $2,190,000 | 19 | 34 | 103% |
| Santa Clara | $1,920,000 | 33 | 11 | 106% |
| Morgan Hill | $1,837,500 | 20 | 33 | 99% |
| Gilroy | $1,150,000 | 29 | 26 | 98% |
Source: SAMCAR and SCCAOR, data compiled by MLSListings, Inc. A selection across both counties and every price tier. The full city list runs longer. Cities with fewer than five closed sales are left out, because one transaction can swing the median.
Which Peninsula Markets Are Running Slower Right Now?
Woodside, Half Moon Bay, East Palo Alto and south Santa Clara County are the counterweight to the list above.
Woodside averaged 98% of list across 5 sales and an average of 91 days, against 30 active listings and 4.5 months of supply. Five sales is the floor for a readable figure, so weigh the 30 active listings more heavily than the median.
Half Moon Bay averaged 102% of list across 8 sales and 41 days, with 34 active listings and 3.8 months of supply. East Palo Alto averaged 97% across 6 sales and 43 days.
South Santa Clara County stayed balanced. Morgan Hill carried 90 active listings against 20 sales at 99% of list and an average of 33 days. Gilroy carried 89 active listings against 29 sales at 98% and 26 days.
Los Gatos averaged exactly 100% of list across 27 sales and 38 days, with 76 active listings. Campbell cleared 103% but took an average of 34 days across 19 sales.
At the top of the market, Los Altos Hills averaged 102% across 13 sales and 28 days at a $7,100,000 median. Portola Valley averaged 105% across 7 sales but took 38 days.
Is the Santa Clara County Condo Market Still Soft?
It firmed a little. The condominium and townhome median rose to $900,000 from $852,500, up 5.6%, and closed sales rose to 279 from 262.
New listings fell to 367 from 459, and active inventory eased to 858 from 901. Sellers averaged 100% of list for a third month, and average days on market held at 41, from 42.
Median price per square foot rose to $716 from $688.
| Measure | September | October |
|---|---|---|
| Median price | $852,500 | $900,000 |
| Closed sales | 262 | 279 |
| New listings | 459 | 367 |
| Active inventory | 901 | 858 |
| Avg. days on market | 42 | 41 |
| % of list received | 100% | 100% |
| Median $/sqft | $688 | $716 |
Source: SCCAOR, data collected and compiled by MLSListings, Inc.
Sunnyvale and Mountain View carried the segment's strength. Sunnyvale closed 35 condo and townhome sales at a $1,290,000 median and 102% of list. Mountain View closed 27 at a $1,380,000 median and 100% of list.
San Jose, which carries the largest share of the county's condo sales, closed 116 at a $707,000 median and 99% of list across an average of 50 days.
Want to see how your city compares on price, pace, and percent of list received? The home price benchmark calculator is now loaded with October 2026 closed-sale data for 40 Peninsula and Silicon Valley cities.
What Does October Mean If You're Buying or Selling?
The practical read depends on which side of the transaction you're on.
If you're selling
- The bid came back. Sellers averaged 108% of list in San Mateo County and 104% in Santa Clara County, up from 106% and 103%. Most of the cities on the list averaged above 100% of list.
- Buyers moved faster. Average days on market fell to 21 and 23. If your home is ready, the market is moving in about three weeks on average.
- Price to your own street. Menlo Park's median fell to $3,250,000 on 25 sales, from $4,169,194 in September, and its median price per square foot was $1,633. A county or city median rarely describes the house next door.
- Supply varies by town. Burlingame ran 0.7 months of supply and Woodside 4.5. The same week to list means different things in each.
If you're buying
- Competition sharpened. Six cities cleared 111% of list or better, and Los Altos did it on 38 sales. Come in with a pre-approval and an inspection plan done before the first weekend.
- The rate is easing from its peak. Freddie Mac's 30-year reading fell to 7.11% on November 12 from 7.40% in mid-October. Run your payment at today's figure before you set a ceiling.
- Negotiating room showed up in specific places. Woodside, East Palo Alto, Gilroy, Morgan Hill and Los Gatos are where October shows the average seller taking list or less. Half Moon Bay and Campbell took more than a month on average.
- Look past the median to percent of list. Santa Clara County's median rose 6.9% while sales fell 7.9%. Fewer homes closing can move a median as much as stronger bidding can.
For the longer view, the Silicon Valley Real Estate Market Report tracks the trend across the year, and the September 2026 report covers the month when listings came back.
Frequently Asked Questions
Q: Did home prices rise in San Mateo and Santa Clara Counties in October 2026?
A: Yes. San Mateo County's median rose 1.1% to $2,200,000, matching May for the highest monthly median from March through October. Santa Clara County's median rose 6.9% to $2,010,000, back above $2 million for the first time since May. Median price per square foot rose 2.5% in both counties.
Q: Did 7% mortgage rates slow the market in October 2026?
A: The bidding didn't slow. Freddie Mac's 30-year rate ran from 6.95% on September 17 to 7.40% on October 8 and 15, and October's sellers still averaged 108% of list in San Mateo County and 104% in Santa Clara County, up from 106% and 103% in September, and average days on market fell to 21 and 23.
Q: Which Silicon Valley and Peninsula cities were strongest in October 2026?
A: By percent of list price received, Atherton led at 113% on 9 sales, followed by Los Altos and Daly City at 112% and San Carlos, San Bruno and Belmont at 111%. Los Altos did it on 38 sales. Sunnyvale and Millbrae cleared 110%.
Q: Is the Santa Clara County condo market still soft in 2026?
A: It firmed a little. The condominium and townhome median rose to $900,000 from $852,500, closed sales rose to 279 from 262, and active inventory eased to 858 from 901. Sellers averaged 100% of list for a third month.
Q: Where is there room to negotiate in this market right now?
A: Woodside, where sellers averaged 98% of list across 91 average days and 4.5 months of supply on 5 sales. East Palo Alto at 97%, Gilroy at 98%, Morgan Hill at 99% and Los Gatos at 100%, with Morgan Hill and Gilroy each carrying about 90 active listings. Half Moon Bay took an average of 41 days.
The bottom line
October brought the fall market back sharper. Medians rose to $2,200,000 in San Mateo County, matching May, and to $2,010,000 in Santa Clara County, its first reading above $2 million since May, and sellers averaged 108% and 104% of list as homes sold in 21 and 23 days on average.
Rates crossed 7% in late September, and the bidding held. The openings have names: Woodside, East Palo Alto, south Santa Clara County, and condominiums.
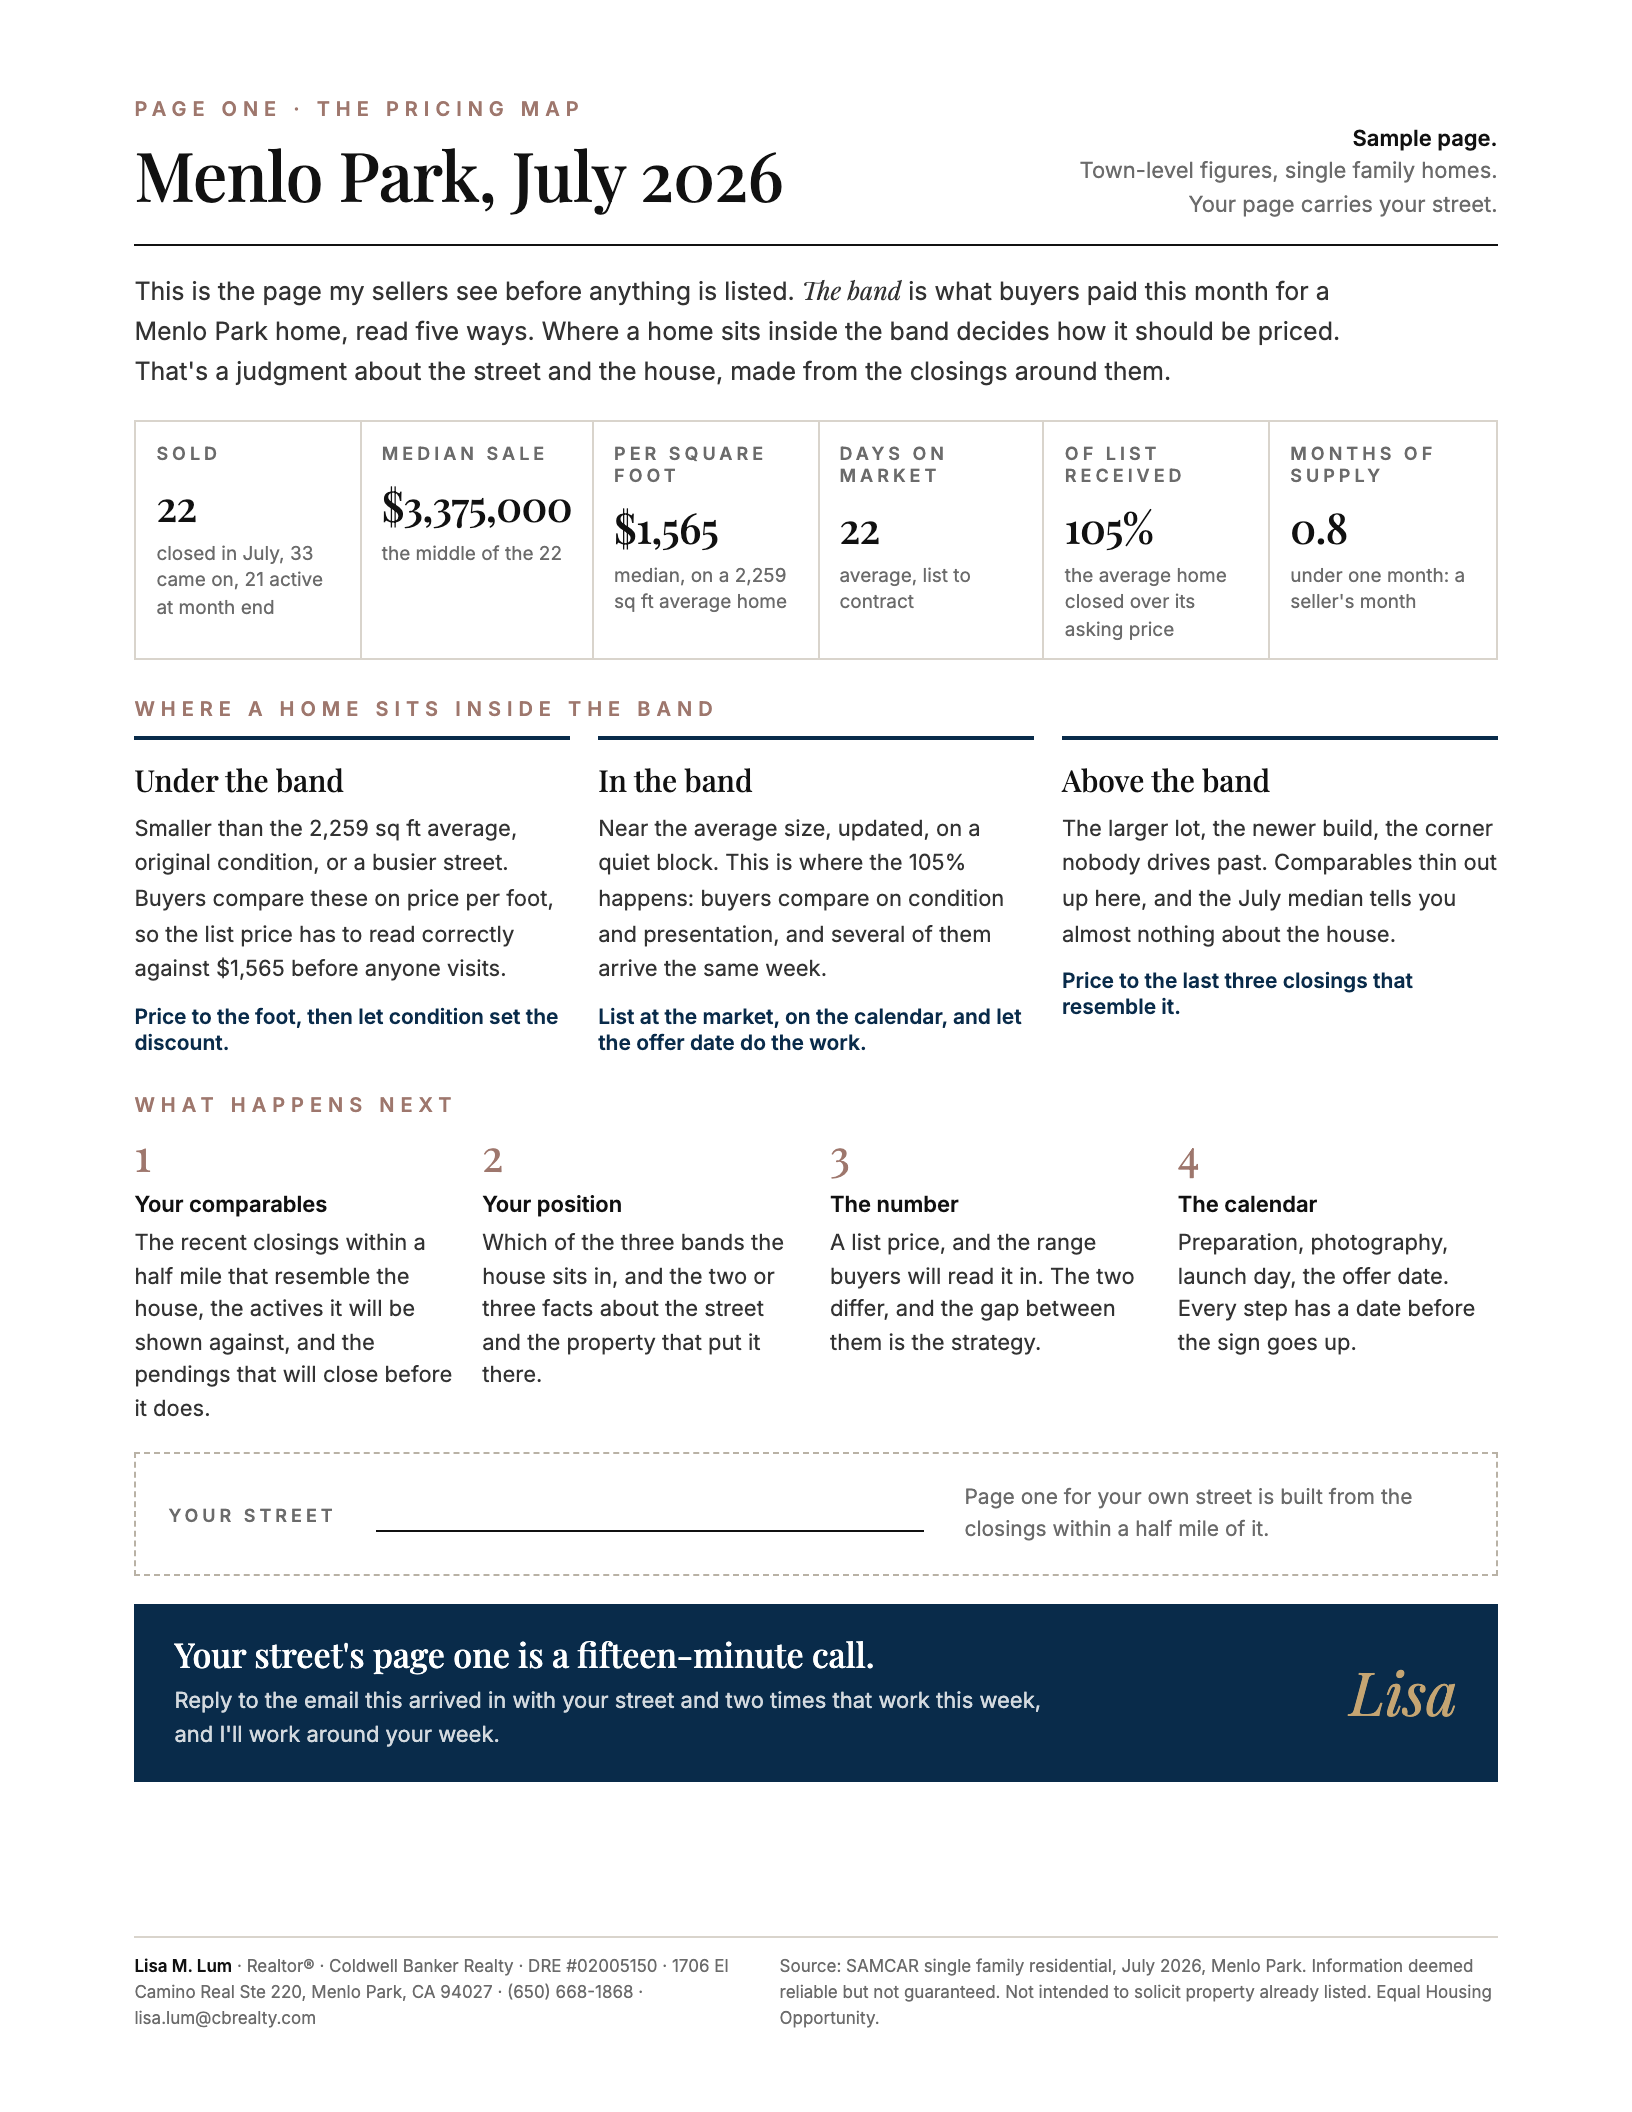
Every market figure above is a countywide or citywide figure. If you want the same read narrowed to your own street, ask for Page One, the one-page pricing map built from this same closed-sale data.
Stay informed: Get monthly market updates and neighborhood insights delivered to your inbox. Subscribe to Lisa's Market Minute.
Know anyone thinking about selling? Send them the home valuation tool.